Google Fusion Tables provide an open source, cloud-based, quantitative analysis software, specifically designed for map creation. Typical users include geographers, sociologists, political scientists, and other social sciences.
| Pros |
Cons |
- Available in Google Drive as a cloud-based program, allowing for convenient collaboration
- Produces options for visualizing data using graphs, charts, and thematic maps
- Ability to merge data from multiple sources
|
- Appropriate for map building purposes only
- Data must include locational data
- Datasets can not exceed 100 MB; each user is only allotted up to 250 MB of data
|
Import and Export File Capabilities
Import: Excel or Open Office files (.xls, .xlsx, .ods), Text files (.txt, .csv) & Web-based (including Google Maps/Google Earth (.kml) and Google Spreadsheets)
Export: Google Maps (.kml) & as embedded web link
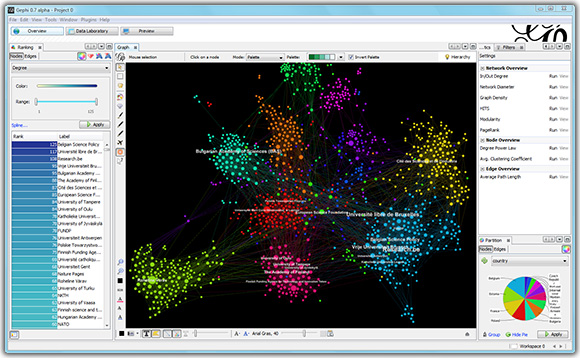
Gephi is an open source quantitative analysis software. Typical users include scientists and the social sciences.
| Pros |
Cons |
- Easy graph import and export
- Many options for visual encoding
- Various layout algorithms to choose from
- Computation of graph statistics
|
- User interface navigation needs improvement
- Some visual glitches
- Version is prone to have system bugs here and there
|
Import and Export File Capabilities
Import: Text files (.csv, .net, .dot), Web-based files (.graphml) & additional formats (.tlp, .gml)
Export: Excel files (.xls, .xlsx), Text files (.csv, .pdf, .net), Web-based files (.graphml, .svg, .gexf) & additional formats (.gdf)
-
-
Learning Julia
This resource provides access to Julia learning materials including books, text and video tutorials, and syntax cheat sheets.
Julia is an open source quantitative analysis software. Typical users include scientists, mathematicians, and engineers.
| Pros |
Cons |
- Can be run via web browser, no download required
- Syntax is similar to other coding languages (such as C and R), making learning intuitive for beginners with coding experience
|
- More suited for those with some background in coding
- Software may be less intuitive for MATLAB users due to high number of syntax similarities with varying meanings
|
Import and Export File Capabilities
Import: Text files (.csv, .tsv, .wsv, .txt)
Export: Text files (.csv, .dat)
OpenRefine (previously known as Google Refine) is an open source pre-analysis software, built for cleaning and transforming messy data. Typical users include the social sciences, humanities, and profit/nonprofit corporations.
| Pros |
Cons |
- Useful when working with messy data that needs to be cleaned or transformed before use
- Connects to database APIs
- Dataset merge capabilities
- Infinite number of undos/redos
- The actions taken to a dataset can be extracted and later applied on additional datasets
- Has web-based interface
|
- Uses programming language GREL which is less known and not always intuitive for beginners
- Is not convenient for data entry; datasets should be uploaded into the program
- Is less suited for large datasets; single columns cannot be collapsed for better viability
|
Import and Export File Capabilities
Import: Excel files (.xls, .xlsx), Text files (.csv, .tsv), Web-based files (.xml, .html, .rdf) & additional formats (.json, .tar, .tar gz, Google Spreadsheets, Google Fusion Tables)
Export: Excel files (.xls, .xlsx), Text files (.csv, tsv), Web-based files (.html) & additional formats (.json, .tar, .tar gz)
Python is an open source quantitative analysis software for both first-time and experienced coders. Typical users include the social sciences, arts, engineers, government agencies, academia, and profit/nonprofit corporations.
| Pros |
Cons |
- Flexible and intuitive programming language
- Syntax allows users to express concepts in fewer lines of code
- Access to supportive Python community for Q&A
|
- Can lack in speed and efficiency in comparison to other software
|
Import and Export File Capability
Import: Excel files (.xls, .xlsx), Text files (.txt, .csv) & additional formats (.sql, HDF5)
Export: Excel files (.xls, .xlsx), Text files ).txt, .csv) & additional formats (HDF5)
-
-
R-Markdown Cheat Sheet
This R-Markdown Cheat Sheet serves as an excellent resource when working with R syntax.
R and R-Studio are open source quantitative analysis software specifically for network and text analysis, data mining, and web scraping. Typical users include scientists, economists, bioinformatics, sociologists, and marketing researchers.
| Pros |
Cons |
- Functions are flexible and versatile
- Works well with large datasets; the size is only limited by the computer during use not the software itself
- Over 6000 user written/contributed packages available through CRAN
- High level of graphics
- Interacts well with other software (i.e. Python, Bioconductor, WinBUGS, JAGS etc.)
- Large supportive online community for Q&A
|
- Can be difficult to navigate without rudimentary understanding of different data types
- Number of user written/contributed packages may be hard to sift through
- No formal tech support
|
Import and Export File Capabilities
Import: Excel files (.xls, .xlsx), Text files (.txt, .dat, .csv), Web-based files (.xml) & additional formats (.sav, .dta, .sas7bdat, .json)
Export: Excel files (.xlsx), Text files (.txt, .csv) & additional formats (.sav, .dta, .json)
Tableau Public is an open source quantitative analysis software with high graphics and an intuitive user interface. Typical users include profit/nonprofit corporations.
| Pros |
Cons |
- Drag and drop user interface allows users of all programming skill levels
- Dashboards allow users to combine multiple views of their data into one analytics tool
- Web-based version and desktop-based version
|
- Free version does not have the full capabilities of the full-scale version, Tableau Desktop.
|
Import and Export File Capabilities
Import: Excel files (.xls, .xlsx), Text files (.txt, .csv) & Access files (.mdb, .accdb)
Export: Text files (.pdf) & Web-based files (embedded web links)
WEKA is an open sources quantitative analysis software developed in New Zealand. Typical users include academia and profit/nonprofit corporations.
| Pros |
Cons |
- Compatible with large or small datasets
|
- Data visualization does not include scatterplots, other plots (e.g. box-whisker, mean/error), or 3D graphs
- Does not import data from Excel
|
Import and Export File Capabilities
Import: Text files (.txt, .csv), Web-based files & additional formats (.arff, .libsvm)